
4 Marketing Questions Answered By Social Analytics
Did you know that custom insights into your own unique audience are available to you right now? No special tracking codes to install, no advanced views to buy. Want to see them? If so, read on as we share four questions we can answer by looking at the social analytics that come for free inside the the social platforms we use the most.

Social Analytics At Your Service
Analytics and reporting come baked into most of the social platforms we use nowadays. The usefulness of these reports may vary greatly (Google+, I’m looking at you). But it is nice to know that we can use the activities we are already doing on social to answer some important business and digital marketing questions.
Here at PINT, Inc. we have been using these tools for some time. But I was inspired to share this post after our boss, Thomas Powell encouraged me to attend the Social Media Seminar put on by the Rady School of Business at the University of California- San Diego in November. Many of the attendees seemed like they were seeing screenshots from these reports for the first time. As a result, I thought it would be useful for others to know about them.
So, here are some of the biggest questions you can answer with the social analytics that come for free with the profiles we create for or our organizations.
1. What type of tweet does my audience like best?
This seems like an obvious question, but Twitter’s own tools are the most helpful for quickly identifying the most successful post in a time period. This is nice, since more advanced reporting from tools like SocialBro or Hootsuite require an upsell.
Accessing Twitter analytics is easy. Simply login to your account, and click on the profile icon at the top right. You’ll see an option for analytics in the resulting dropdown menu.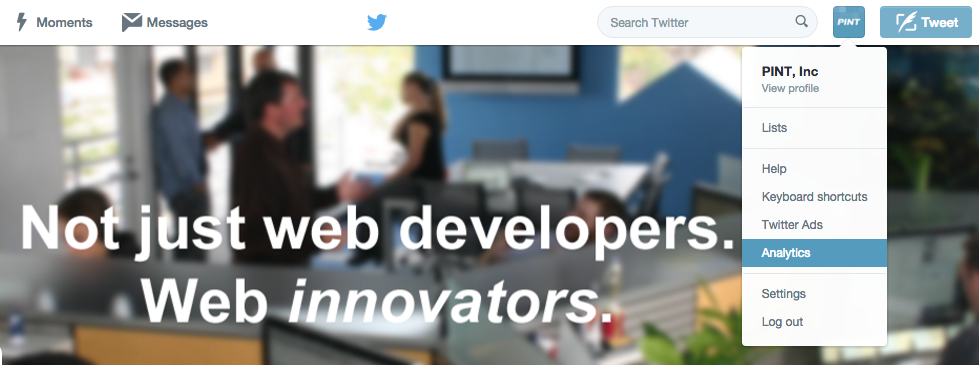
If you don’t see this option, not to worry. You can access all the analytics by logging in through https://analytics.twitter.com/accounts and turning on analytics.
The home screen for analytics is easy to use and quite helpful.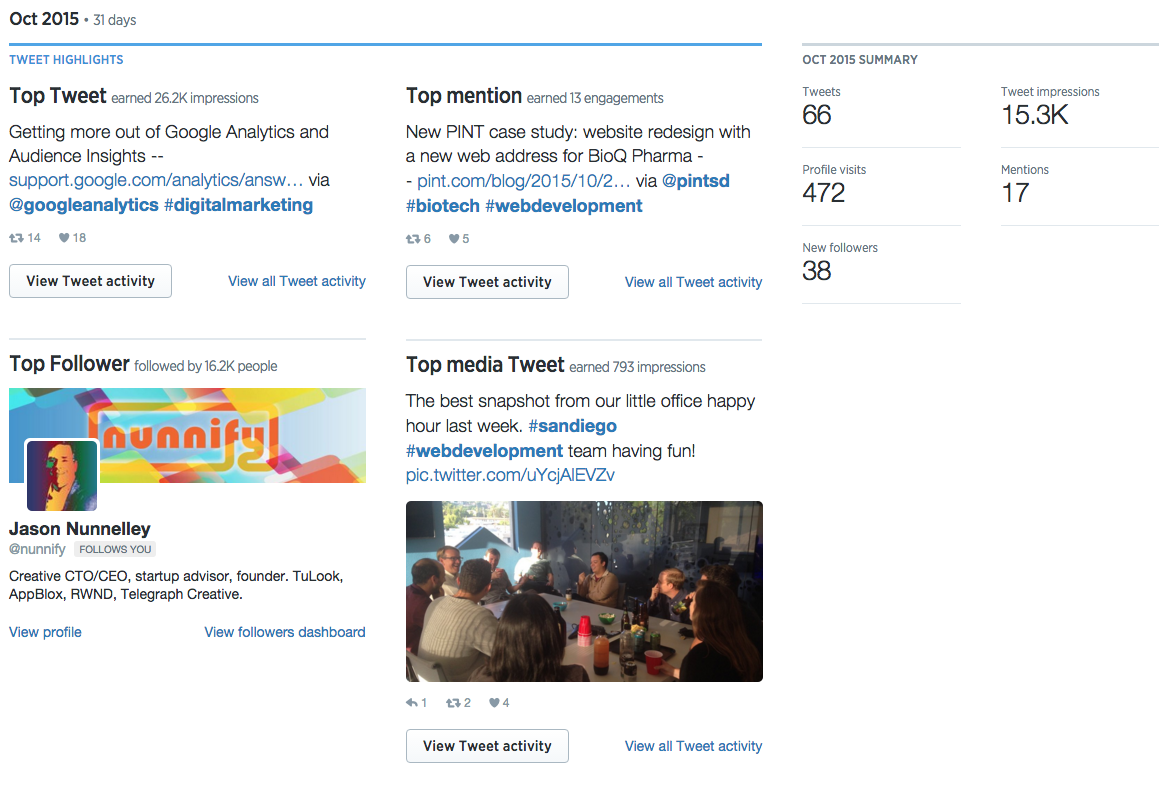
This shows you the top tweet you made in a month, and the top tweet you made which included media (photo or video). There are a few ways to look at this data. Which type of tweet got more exposure? Exposure is ranked by Twitter with the term “impressions.” So in the example above, you can see our top tweet had over 26,000 impressions. Meanwhile, our top media tweet earned 793 impressions. Let’s look at why this might be the case:
- One reason might be that our audience prefers links to photos. However, this would be an exception to general findings.
- Another reason might be the hashtags we used. #sandiego #webdevelopment have a smaller audience than #digitalmarketing.
- A little digging shows that @GoogleAnalytics actually retweeted our tweet. That really expanded the number of people who saw it, which made it a big winner in October.
2. Which particular tweets engage most?
At the top of the home screen in Twitter analytics, you’ll see a summary for the last 28 days. Right now we’re looking at the Twitter stats for one of PINT’s software products, ZingChart.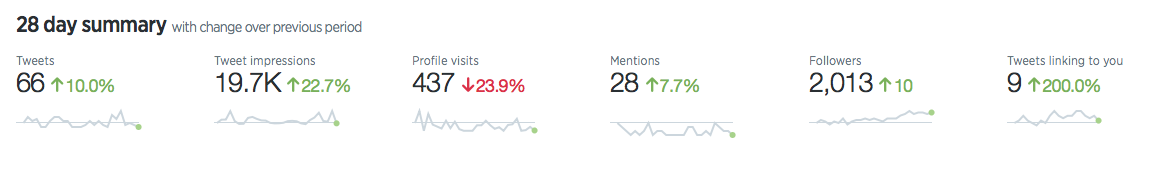
This helps us identify general patterns for engagement. Are we tweeting about something recently that causes these numbers to go all green or all red?
If you access the top navigation, you can drill down further to find out which tweets are the most successful.
When you click on the Tweets option, you can view the individual days with the most engagement by link clicks, retweets, and likes. Then you can look into the most successful days to identify the top performing tweets.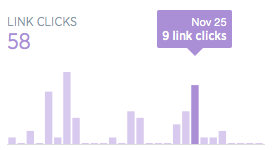
In this example, November 25 was a good day for link clicks. Let’s look at our tweets on that day to see what people were clicking.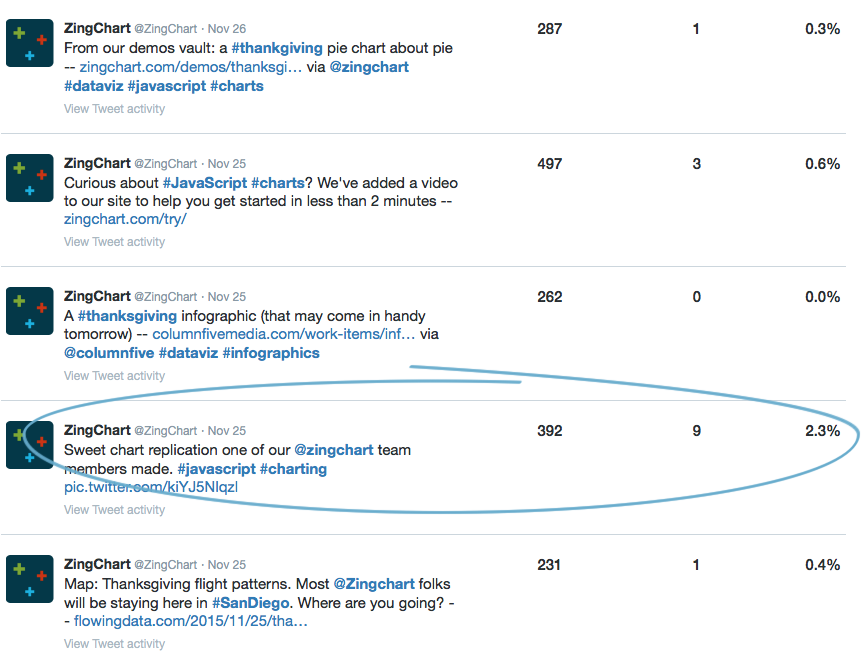
Here we can see impressions, engagements, and engagement rate by each tweet. Looks like our “sweet chart replication” tweet was a winner that day. And we included a picture in the tweet, instead of a link to our site. If we see this happening on all our best days, we should definitely consider posting more pictures instead of links.
3. Are there any detailed demographics on my customers?
Yes, there are. While Twitter offers some follower demographics, Facebook is the place to find more detailed info. To access this data, log into Facebook, and start “using Facebook” as your organization. You’ll know you’re in the right place, when you see your organization’s profile logo in the top nav, instead of your own personal profile picture. Then, click on the top navigation and choose “insights.”
From here, look to the left hand navigation for “people” and you’ll get a nice overview of your followers details.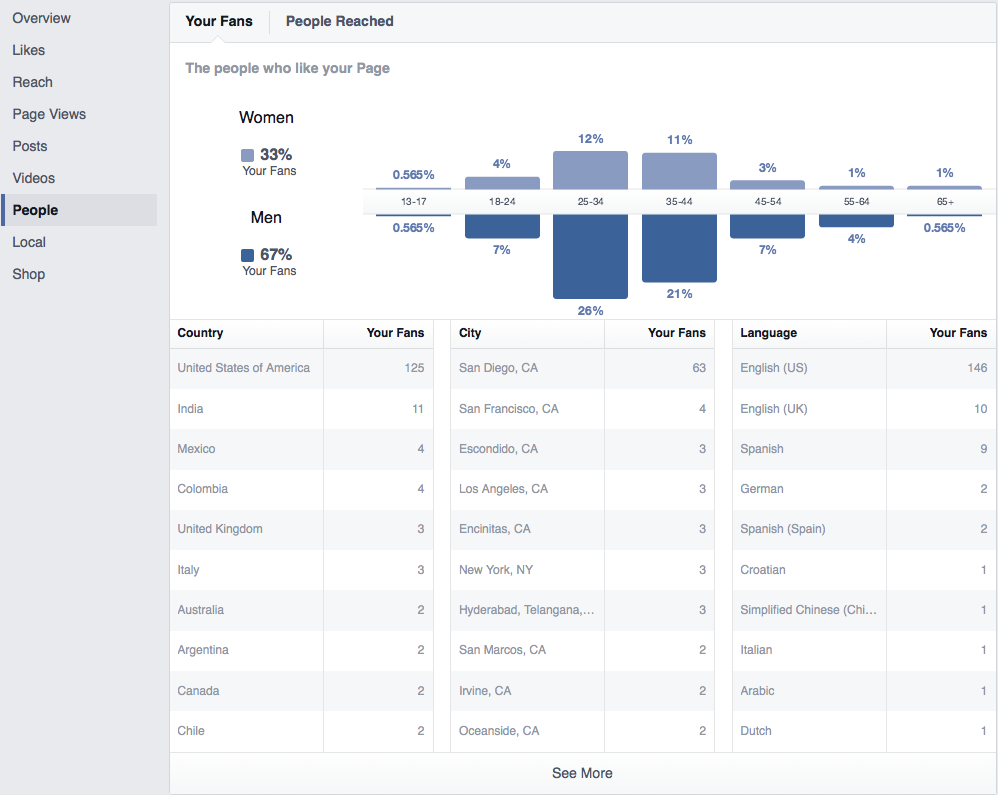
In this view, we can see how followers breakdown by:
- Gender
- Age
- Country
- City
- Language
You could use this follower data to make decisions about offline marketing, product selection, and more.
If you click the “local” tab, you can even get data on when people are on Facebook and when they are near your physical location.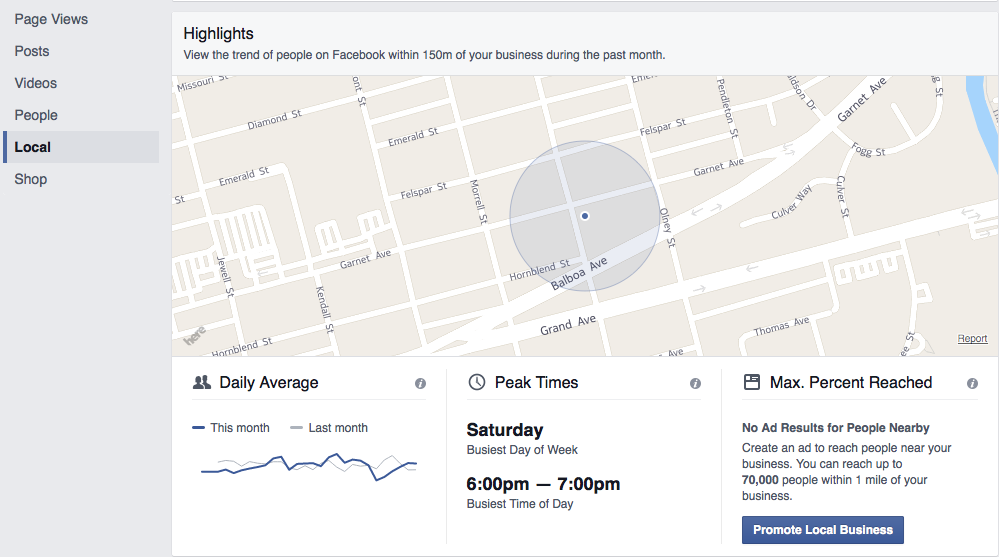
For us at PINT, Inc., this is less relevant since we don’t get a lot of walk-in business. However, if you have a brick and mortar for retail or physical services, this would be great customer information to have.

By the way, if you’re wondering why Saturday evening is a popular time for people on Facebook to be nearby, it is because PINT is located in a beach town called Pacific Beach and young folks like to come to this neighborhood to have a good time.
4. How much seniority do my B2B customers have?
LinkedIn is a great place to learn about customers who come to you through their work, or business to business (B2B) customers. You can access information about people who follow your organization on LinkedIn by going to the same place where you add your company updates, and clicking on “analytics” in the navigation.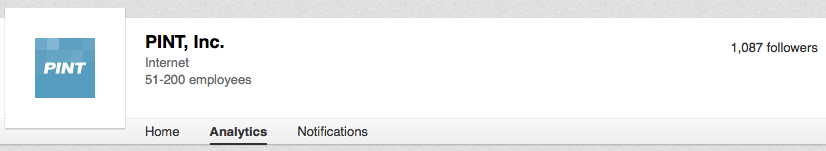
If you scroll down to the “followers” section you get a great overview of the roles your followers play in their respective companies.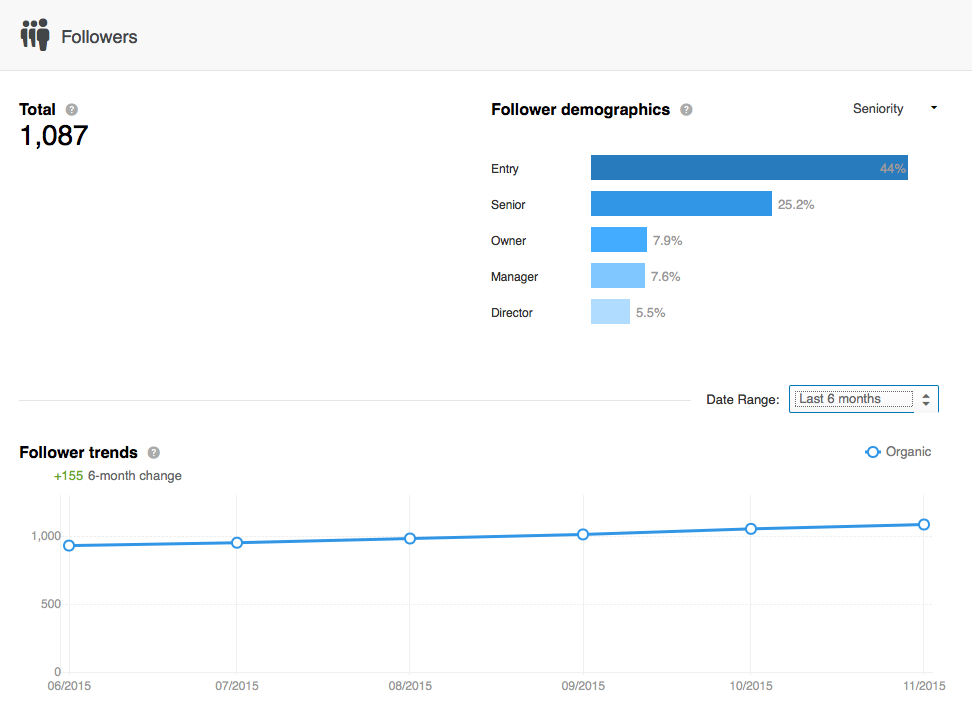
This type of data can give you insight into how you should craft your messages if the majority of your customers are B2B. In the example above, messaging geared toward C-Level executives would not be appropriate for the bulk of our followers.
You can also view LinkedIn visitor demographics. This report will likely look similar to your follower trends, but it is about all the people who visit your company’s LinkedIn page, not just those who follow it.
LinkedIn is also useful for a little competitive research. You can see how your company’s LinkedIn presence stacks up to competitors very easily. And the selected competitors tend to be more relevant than those found in Facebook or Twitter analytics.
5. Bonus: How many potential customers are there for my product in a certain geographic area?
To answer this question, we’re going to use the Facebook Ad Builder. But don’t worry, we’re not actually going to buy ads. After all, we promised these tools were free!
Access the tool by logging into Facebook and clicking on the dropdown arrow at the far right.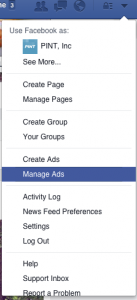
Select “manage ads,” and start a campaign. In this view, you will be able to set the following details:
Interests of the group you’d like to target, as well as:
- Age
- Gender
- Location
You don’t need to actually run the ad, but you can drill down into that audience you created to see how many people on Facebook fall under those parameters.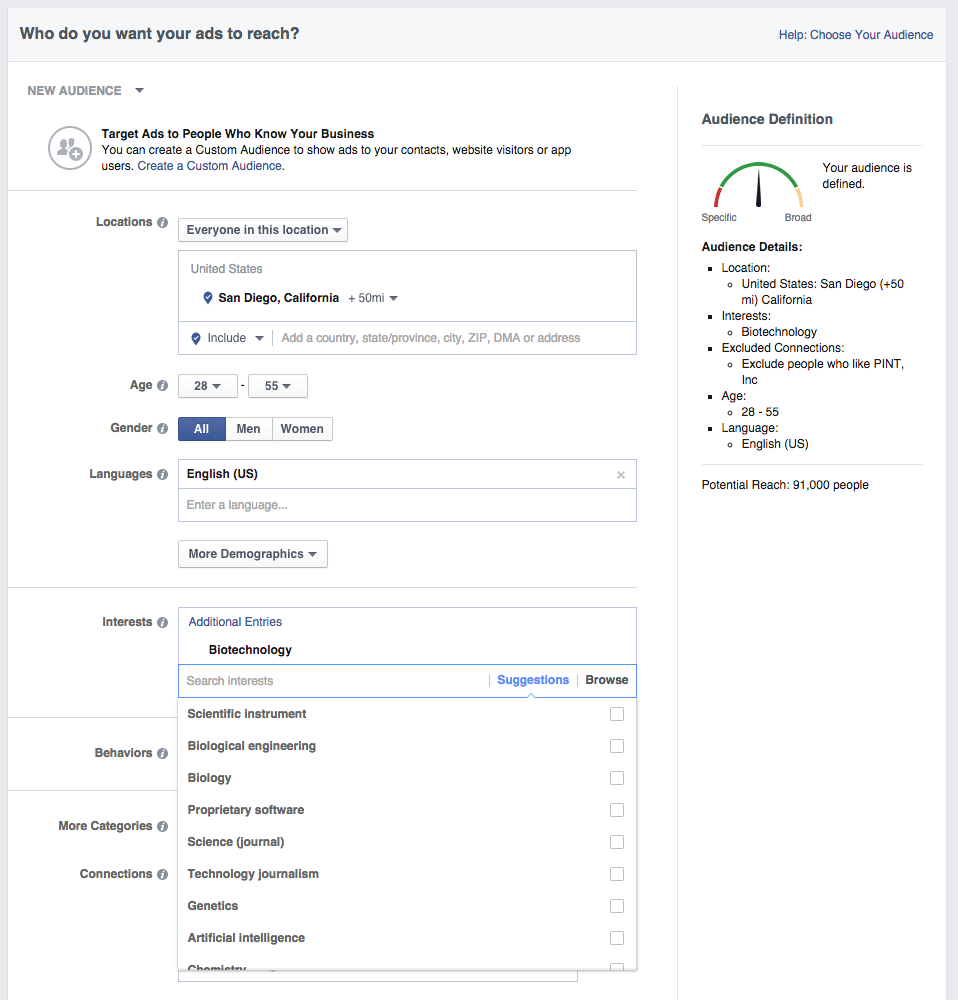
In the example above, we set an age range for people within 50 miles of San Diego who are interested in biotechnology. You can add multiple interests and also get pretty specific. This is a more hidden tool within Facebook that can help with your market research for a given area.
Social Analytics for Custom Data
Which gratis analytics do you rely on most? Share the reports you use in the comments section below.